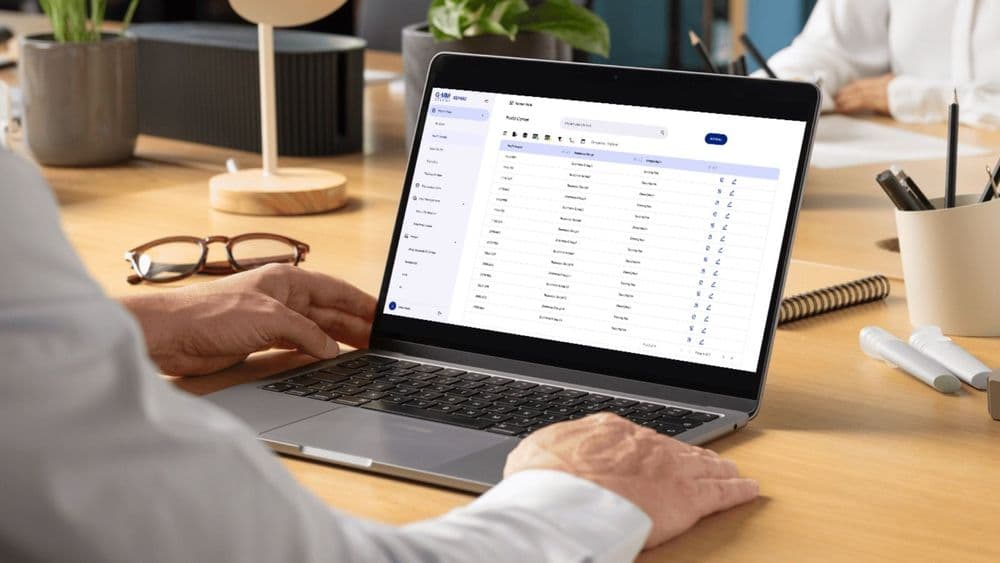
GMM Grammy
30+ accounting reports on demand for GMM Grammy
- Enterprise Software Development
- Data & Analytics
- UX/UI Design & User Research

We bring data from your existing systems into one model, agree what each figure means, and build the reports and dashboards your teams need, in Power BI or as a tailor-made web application.
Data and analytics means turning the data your organisation already holds into reports people act on: pipelines that load it, a model with agreed definitions, and reports or dashboards on top.
For GMM Grammy's accounting team we built more than 30 company and consolidated reports from one datamart, with drill-down, Excel export and access limited by company. The back office we built for MEMO Clothing includes a real-time dashboard of buying trends.
Departments report different numbers
Each team extracts and calculates figures its own way, so the same measure differs in every meeting.
Monthly reporting is manual
Staff export from several systems into Excel and reconcile figures by hand before anyone can read them.
Nobody trusts the dashboards
Figures change without explanation or go stale when a load fails, so people return to spreadsheets.
Years of records answer no simple questions
The data sits in systems built for transactions, and pulling a basic trend needs a developer.
Pipelines and reconciliation
Scheduled loads from your systems and files, checked against source totals, with an alert when a load fails.
Warehouse or datamart design
A data model shaped around the questions asked, kept as simple as they allow.
Agreed definitions
One written meaning for each figure, such as active customer or net revenue, with a named owner.
Reports and dashboards
Power BI, or tailor-made web reports with drill-down and Excel export where a BI product does not fit.
Access by role
Each user sees only the companies or records they may see, and personal data stays out unless needed.
Every engagement runs through the same six-stage fitting process, from the first consultation to long-term care. The stages stay in the same order; how deep each one goes depends on the project.
See the full fitting processWe start by listing the decisions the reports should support and who makes them, then work back to the data. That usually narrows the scope.
Next we agree definitions. Ask three departments how many active customers there are and you may get three numbers: one excludes dormant accounts, one counts by billing entity, and one leaves out internal test records. Each is a fair answer to a slightly different question. We write down one definition per figure, name an owner, and build the model on that.
Then we build one report end to end and reconcile it against the source systems before adding more. Every pipeline logs its runs, so a failed nightly load raises an alert, and the dashboard shows when its data was last refreshed. We keep the model as simple as the questions allow and document each definition, so your analysts can extend it.








Engagements span build, integration and long-term support. Named with permission; clients under NDA are not listed.
The main factors are the number and condition of the source systems, how many reports are needed, whether definitions are already agreed, the access rules and how much history must be loaded. We give a written estimate after a short scoping call, or price against the TOR for public-sector work.
Not always. If your questions can be answered from one system, reporting directly against it is simpler and cheaper. A warehouse or datamart earns its cost when questions span several systems, when you need more history than the source keeps, or when reporting queries slow down an operational system.
Usually the one your analysts already know, and Power BI is the one we meet most often. Where reports need fixed layouts, access rules by company or a particular Excel export, a tailor-made web application can fit better. GMM Grammy's accounting reports are built that way.
Clean it against the questions you want answered. Data can be adequate for one decision and unusable for another, and a general cleansing programme with no question attached tends to run without an end. We fix what blocks the reports in scope and show the remaining gaps in the reports.
As a design input. Most reporting needs aggregated figures, so personal data is kept out of the model where possible, and any view of individuals gets access control by role. Exports have a retention rule. Your advisers interpret the legal obligations, and we build the measures into the system.
GMM Grammy
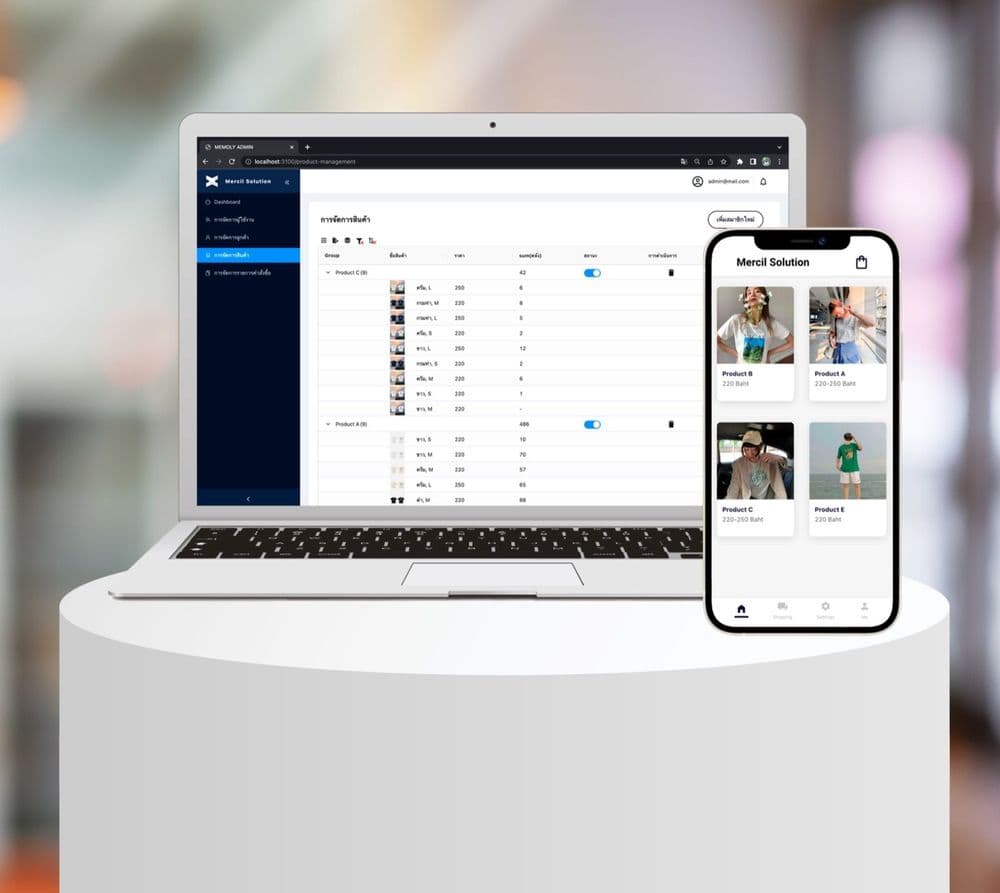
MEMO Clothing
97%customer satisfaction, up from 53%
Next step
Tell us about the problem you are trying to solve. A senior person reads every inquiry and replies with our view of fit, scope and cost, including when another option would suit you better.
We use essential cookies to make this site work and, with your consent, Google Analytics and Hotjar session recordings to understand how it is used. Forms are hidden in recordings. Cookie policy